mectrics
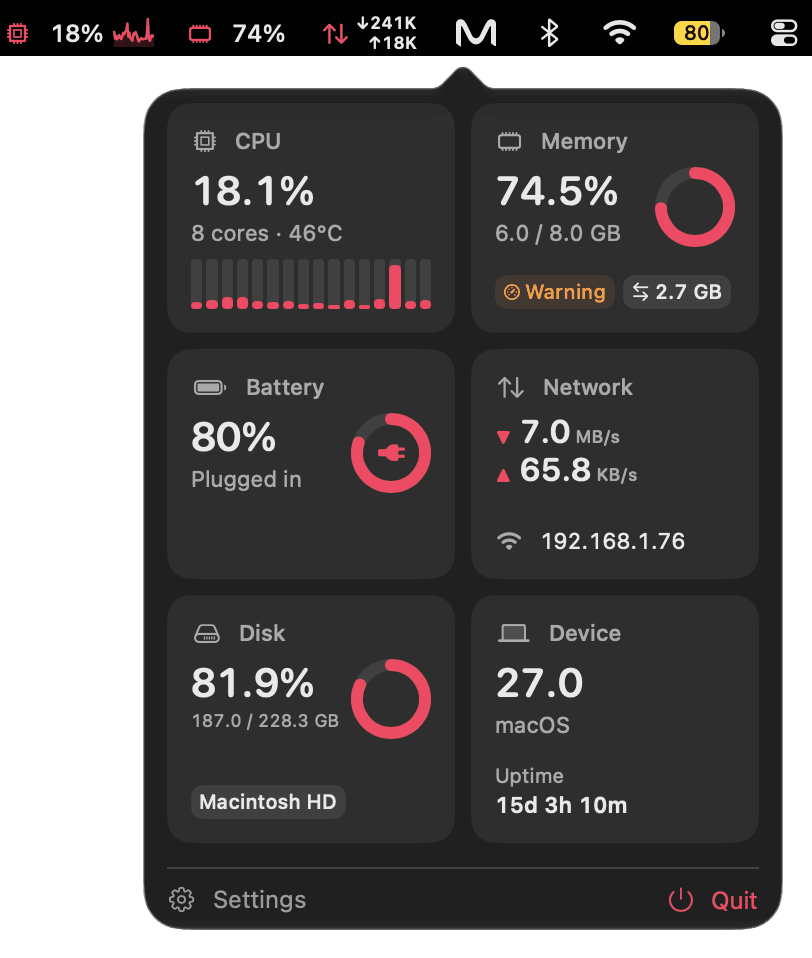
A native menu-bar monitor for the Mac: CPU, memory, battery, network, disk, GPU, temperature and fans, readable at a glance. Open source, with zero telemetry.
The problem
Menu-bar monitors tend to show too little, or fill the bar with numbers that shift sideways every second, and many of them send usage data home. I wanted one that stays still, costs almost nothing to run and sends nothing.
What I built
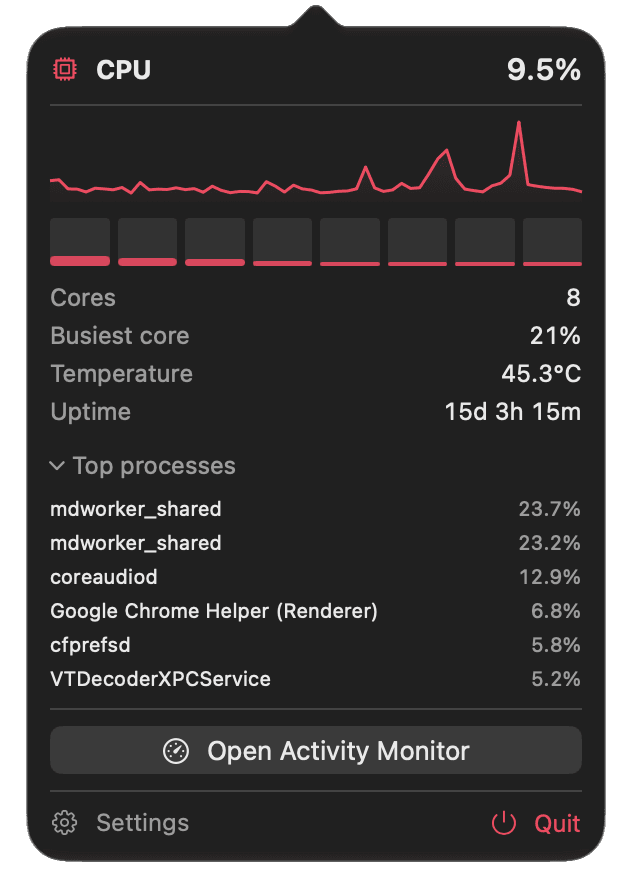
A native app. Swift and SwiftUI. One icon opens every reading as a dashboard of cards, and any module can get its own menu-bar item with a fixed width and a live sparkline. The icon carries a badge when something needs attention.
Light by design. Memory and CPU budgets of 60 MB and 3% of one core, measured in half-hour runs before each release. Sampling slows down on battery and in Low Power Mode. A missing reading shows a dash, never a made-up zero.
Shipped in the open. MIT licence, a signed and notarised download, CI on GitHub, a widget, and diagnostics you can read before you save them.
What happened
It uses about 27 MB of memory while it runs. Twelve releases between July and September 2026.
Stack
Swift · SwiftUI · AppKit · WidgetKit · GitHub Actions